Dust Cluster Rotation - 3-D Phase
Diagram
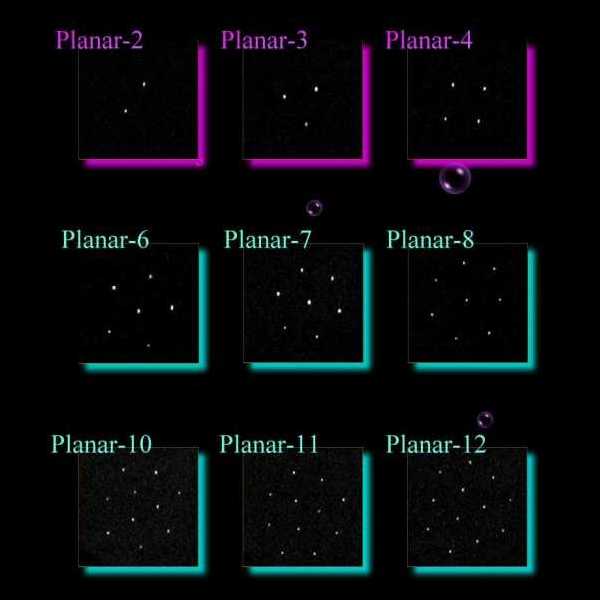
Dust clusters from two to twelve particles in a plane were formed and rotated
in the experiment using magnetic field (see figure 1). At the same magnetic
field strength setting, clusters with smaller number of particles appears to
exhibit "Periodic Pause" more so than the clusters with higher number
of particles. In the following chapter, the phase diagram obtained for these
clusters will be shown.
-
Figure 1 - Dust cluster configurations formed in our cluster rotation
experiment. The particles were rotated using an axial magnetic field. The
clusters with smaller number of particles exhibit "Periodic Pause" even at low
magnetic field strength setting.
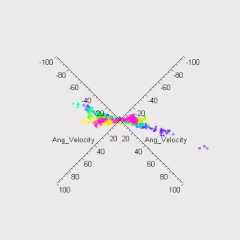
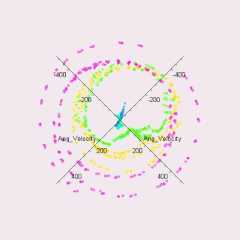
Phase Diagram
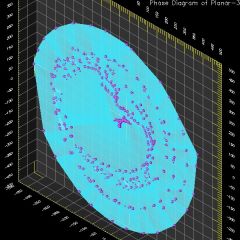
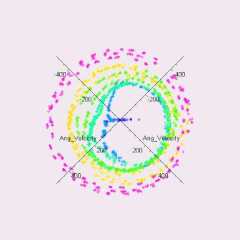
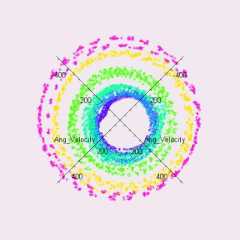
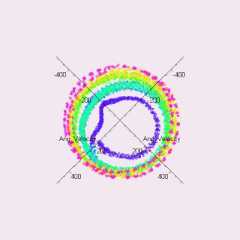
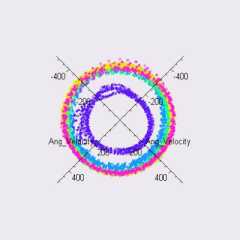
Here we examine the angular velocity vs. angular
position of the particles in the dust cluster in 3-D (see figure 2). Such
plot is called a phase diagram and it is a typical method in studying
oscillatory motion. The hue color scale in the vertical direction was used to
indicate the different magnetic field strength settings (blue = 15G through to
red = 90G). An animation was produced by revolving the camera along the phi
angle so that structure of the 3-D phase diagram can be examined in details.
|
 |
 |
 |
|
Planar-2 (910kb)
(GIF) or
Planar-2 (1,325kb) (MOV) |
Planar-3 (1,336kb)
(GIF) or
Planar-3 (2,042kb) (MOV) |
Planar-4 (1,573kb)
(GIF) or
Planar-4 (2,447kb) (MOV) |
|
 |
 |
 |
|
Planar-6 (2,062kb)
(GIF) or
Planar-6 (3,165kb) (MOV) |
Planar-7 (1,746kb)
(GIF) or
Planar-7 (2,595kb) (MOV) |
Planar-8 (GIF) or
Planar-8 (MOV) |
|
 |
|
|
|
Planar-10 (1,729kb)
(GIF) or
Planar-10 (2,523kb) (MOV) |
Planar-11 (GIF) or
Planar-11 (MOV) |
Planar-12 (GIF) or
Planar-12 (MOV) |
-
To see animation of the phase
diagram for the different cluster configuration, please click on the link
underneath the image.
-
To see animation of ALL phase diagram
simultaneously (will take a long time to download), please click here.
Figure 2 - Phase diagram
of dust clusters from two to twelve particles. The angular velocity has
actually been scaled up 1000 times the actual value (except Planar-2).
The advantage of using such phase diagram is that
the occurrence of "Periodic Pause" becomes apparent. For if the dust particles
in the cluster undergo uniform angular motion, a circular phase diagram is
expected. If the particles exhibit "Periodic Pause", then the phase diagram
would be deformed. And if the particles oscillate about a particular angle, then a straight line
would be obtained.
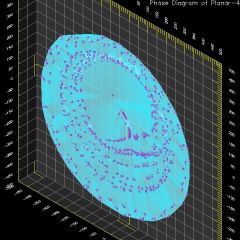
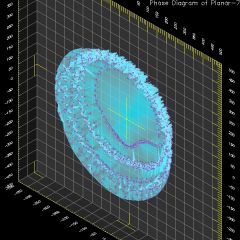
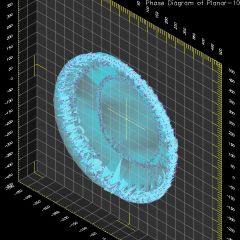
Phase Surface
Here we extend the previous visualization of
phase diagram into phase surface in 3-D (see figure 3). Such plot is will show how the
"Periodic Pause" disappears as the magnetic field strength increases. An
animation was produced by revolving the camera along the phi angle so that
structure of the 3-D phase diagram can be examined in details.
-
To see plot of the phase
surface for the different cluster configuration, please click on the link
underneath the image.
-
-
Figure 3 - Phase surface
of dust clusters from two to twelve particles. The angular velocity has
actually been scaled up 1000 times the actual value (except Planar-2).
The advantage of plotting a phase surface is that
we get to visualize how angular velocity varies with magnetic field strength as
a continuous function. In some of these phase surface, we see that angular
velocity actually saturates even though the magnetic field was increased. This
is indicated by the cylindrical shape of the phase surface at high magnetic
field strength settings.
Asymmetrical Potential Well
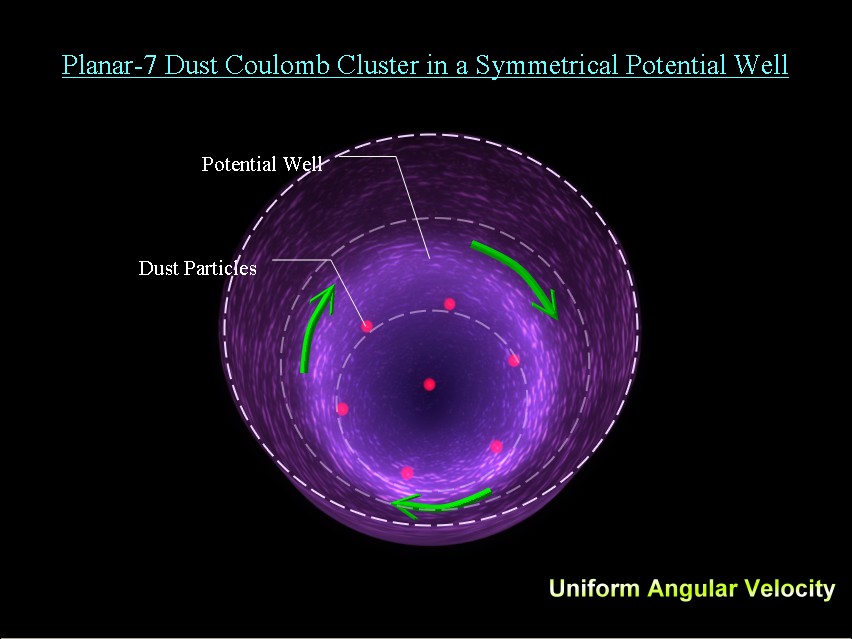
The rotation of the dust cluster is not uniform
especially when the magnetic field strength is low and the number of particles
is small. The reason why such periodic motion occurs is still unknown. One
reason could be that the particles in the dust clusters normally go under
uniform rotation (see figure 4). However, it is highly probable that the
potential well which was used to confined the particles might not be perfectly
circular.
-
Figure 4 - For an ideal electric potential, the particles in dust
cluster should go under uniform rotation. In this visualization, the
particles on the outer ring in planar-7 are going under uniform rotation. This visualization is drawn using
Maya Unlimited 4.0 and Ulead PhotoImpact 7.
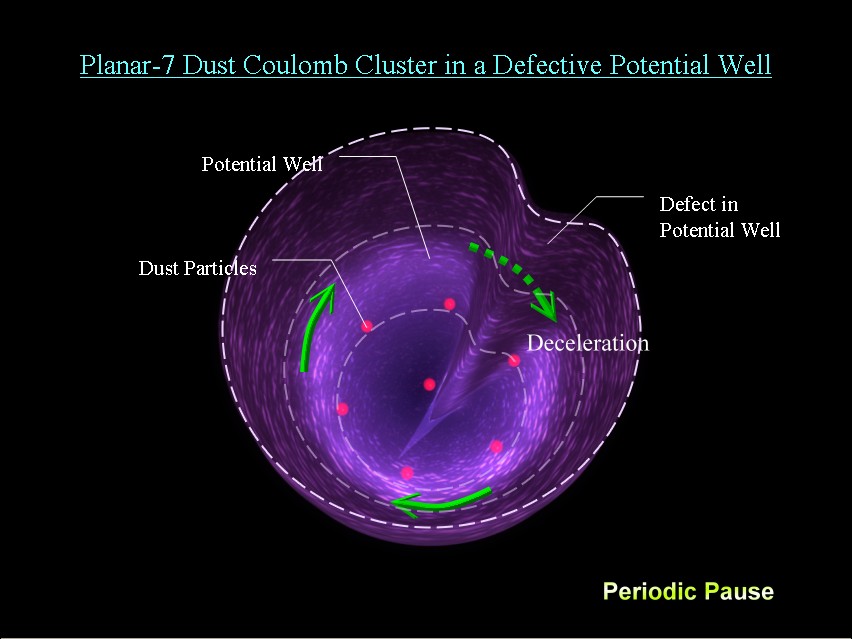
And if we have a hill in the potential well, then
the particles will decelerate (see figure 5). This potential irregularity
could be due to the asymmetry in the apparatus setup. As a matter of fact, if
the particles are unable to overcome this potential hill, then the cluster
will not be able to initiate rotation. This coincides with the phase diagrams
we obtained in figure 2.1.1. At low magnetic field, because the particles does
not have enough driving force to push it over the potential hill, oscillatory
motion at a particular angle was observed. And if we look at the phase diagram
for planar-2, we see that the angle at which the particles oscillate about
increase gradually as magnetic field strength increases. This would coincide
with the theory of asymmetric potential well.
-
Figure 5 - However, if there is a potential hill in the electric
potential well, then the particles in a dust cluster must overcome the
potential hill during its rotation. As a result, the angular velocity of the
cluster would decelerate. In this visualization, the particles on the outer
ring of a planar-7 cluster went under deceleration because of the defect in
the potential well . This defect could be due to the asymmetry in the
experimental setup. This visualization is drawn using Maya Unlimited 4.0 and Ulead PhotoImpact 7.
For the full story, please click
here.