1.3 - Dataset Background
-
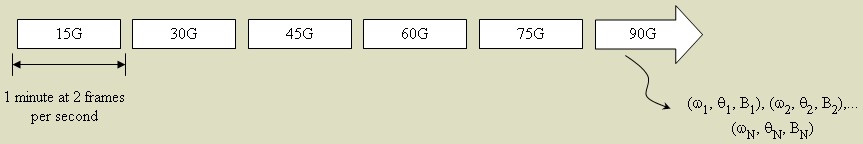
Figure 1.3.1 - A schematic diagram of the data acquisition process. The
axial magnetic field strength was increased stepwise every one minute.
In our experiment, the clusters were set into
rotation using an axial magnetic field. The magnetic field strength started at
15G for the first minute. And then for every minute, the magnetic field was
increased stepwise by 15G increments up to 90G (see figure 1.3.1). So the whole experiment lasted
for about 6 minutes. The motion of the cluster rotation was recorded with the use of
a video camera at frame rate of 2fps. A tracking software was then used to
track the particle trajectories for each frame from the video. As a result,
the angular position for each of the particles in a dust cluster can be
measured as a function of time. In addition, the angular velocity of the
particles and the magnetic field strength can also be obtained. These
information was then stored as a raw dataset in MS Excel (.xls) format which
was used in this project (see figure 1.3.2).
-
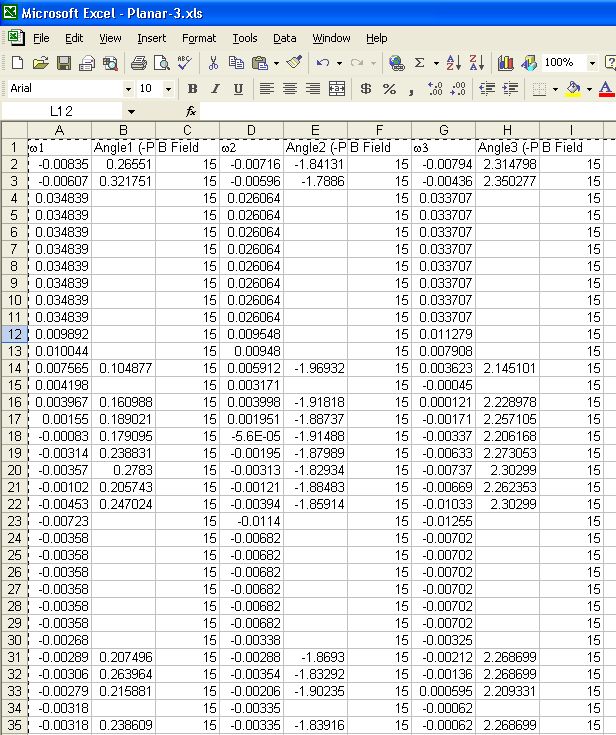
Figure 1.3.2 - This is the raw dataset for planar-3 which consists of the
measured value of the angular velocity, angular velocity and magnetic field
strength.
Typically in the Excel dataset, every 3 columns are
the values of the angular velocity, the angular position and the magnetic
field strength of the dust particles. That is, (w1,
q1, B1), (w2,
q2, B2), (w3,
q3, B3),
... And
naturally, these values represents the radial, azimuthal and the axial
component in a cylindrical coordinate system in our visualization. The number
of columns is determined by the number of particles in the cluster (e.g. 6 x 3
=18 columns for planar-6). The number of frames is determined by the number of
frame captured (e.g. 6 x 60 x 2fps = 720 rows for 6minutes of captured video).
The dataset is in scattered data format.