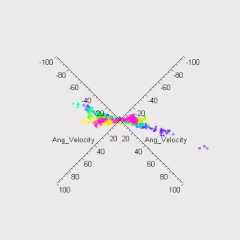
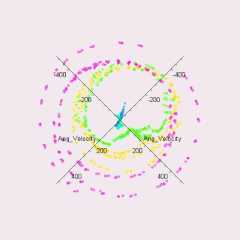
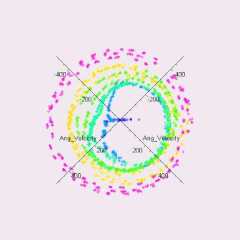
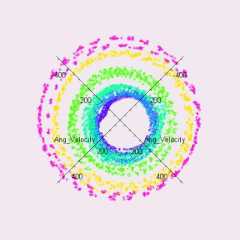
2.1 - Phase Diagram
Here we examine the angular velocity vs. angular
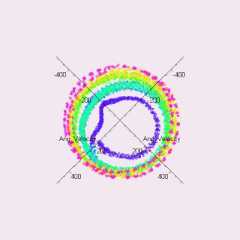
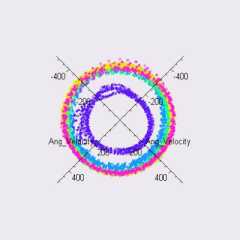
position of the particles in the dust cluster in 3-D (see figure 2.1.1). Such
plot is called a phase diagram and it is a typical method in studying
oscillatory motion. The hue color scale in the vertical direction was used to
indicate the different magnetic field strength settings (blue = 15G through to
red = 90G). An animation was produced by revolving the camera along the phi
angle so that structure of the 3-D phase diagram can be examined in details.
|
 |
 |
 |
|
Planar-2 (910kb)
(GIF) or
Planar-2 (1,325kb) (MOV) |
Planar-3 (1,336kb)
(GIF) or
Planar-3 (2,042kb) (MOV) |
Planar-4 (1,573kb)
(GIF) or
Planar-4 (2,447kb) (MOV) |
|
 |
 |
 |
|
Planar-6 (2,062kb)
(GIF) or
Planar-6 (3,165kb) (MOV) |
Planar-7 (1,746kb)
(GIF) or
Planar-7 (2,595kb) (MOV) |
Planar-8 (GIF) or
Planar-8 (MOV) |
|
 |
|
|
|
Planar-10 (1,729kb)
(GIF) or
Planar-10 (2,523kb) (MOV) |
Planar-11 (GIF) or
Planar-11 (MOV) |
Planar-12 (GIF) or
Planar-12 (MOV) |
-
To see animation of the phase
diagram for the different cluster configuration, please click on the link
underneath the image.
-
To see animation of ALL phase diagram
simultaneously (will take a long time to download), please click here.
Figure 2.1.1 - Phase diagram
of dust clusters from two to twelve particles. The angular velocity has
actually been scaled up 1000 times the actual value (except Planar-2).
The advantage of using such phase diagram is that
the occurrence of "Periodic Pause" becomes apparent. For if the dust particles
in the cluster undergo uniform angular motion, a circular phase diagram is
expected. If the particles exhibit "Periodic Pause", then the phase diagram
would be deformed. And if the particles oscillate about a particular angle, then a straight line
would be obtained.