
-
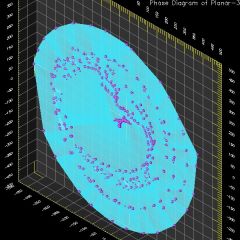
To see plot of the phase surface for the different cluster configuration, please click on the link underneath the image.
-
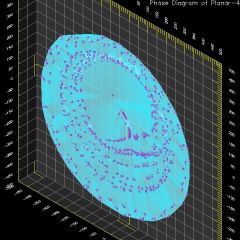
To see plot of the phase surface for the different cluster configuration, please click on the link underneath the image.
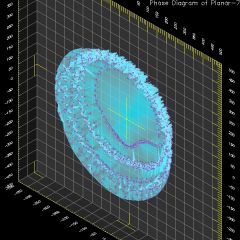
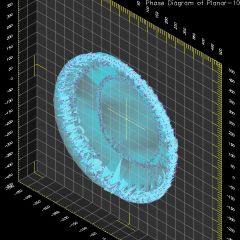
The advantage of plotting a phase surface is that we get to visualize how angular velocity varies with magnetic field strength as a continuous function. In some of these phase surface, we see that angular velocity actually saturates even though the magnetic field was increased. This is indicated by the cylindrical shape of the phase surface at high magnetic field strength settings.