To create a visualization in OpenDX, a general (.general) file for the data explorer was created. The general file is necessary because it allows OpenDX to know where and how to prompt for the dataset. The script for the general file is as follows:
file = /tmp_mnt/home/cheung/planar-7.dat
points = 3840
format = ascii
interleaving = field
field = locations, number
structure = 3-vector, scalar
type = float, float
end
The general file above was written for planar-7 cluster. The number of points was calculated from the number of frames captured multiply by the number of particles. In the case of double ring cluster (e.g. planar-10, -11 and -12), only the particles on the outer ring were studied. So the number of data points for these clusters were less than usual.
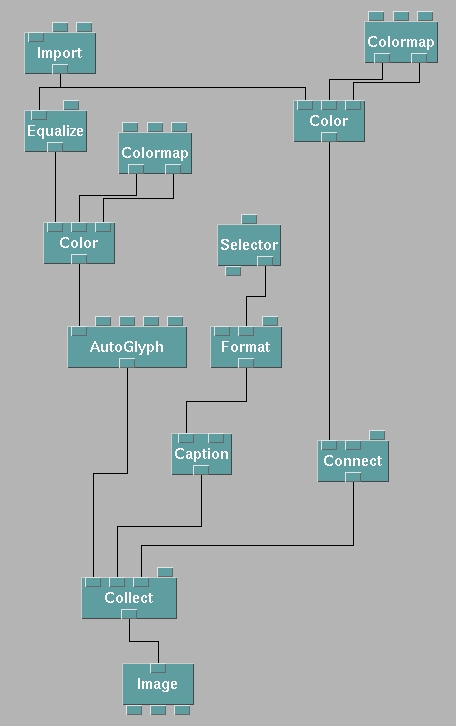
The following visual program was used to generate the phase surface in OpenDX for chapter 2.2.
Figure 5.2.1 - The visual program used to generate the phase surface in chapter 2.2 in OpenDX.
Here are the explanation for the function of the individual modules used.
Annotation: These tools add various kinds of information to a visualization.
AutoGlyph
Produces glyphs (a representational figure, such as an arrow) for every data
value in an input Field. The size and type of glyph are based on the data it
receives.
Caption
Creates a caption for an image. The caption position specified in pixel- or view
port-relative coordinates. Captions always remain aligned to the screen.
ColorBar
Creates a color bar to be displayed on the screen. It accepts a color map as
input.
Format
Creates a string from numeric values. For example, you can create the string "Isosurface
value = 23.4", where 23.4 is the output of an Interactor.
Import and Export: These tools typically process data
immediately after it has been imported.
Import
Brings data into Data Explorer from a specified file. If the file contains more
than one variable or contains multiple frames of data, portions of the data can
be specified for importation. Supported formats are native Data Explorer format,
CDF, netCDF, HDF, and General Array format.
Selector
Presents an option menu, a set of radio buttons, or a toggle button. The outputs
are a value and a string, representing a choice from a selection.
Realization: These tools create structures for rendering and display (e.g., bands, triangle connections, isosurfaces, and boundary boxes).
Connect
Creates triangle connections for a Field of scattered positions.
Rendering: These tools create a displayable image from a renderable object or modify the visual characteristics of the object(s) being displayed.
Image
This tool renders and displays an image to the screen. It performs like the
AutoCamera and Display modules combined. Using the Image tool to render an image
enables many direct interactors that are not available when using AutoCamera and
Display. These options are available in the View Control option of the Options
pull-down menu in the Image window. For example, see "Controlling the Image:
View Control..." in IBM Visualization Data Explorer User's Guide. The Image tool
is available only in the graphical user interface.
Special: Tools in this category can be used in visual programs for a variety of purposes.
Colormap
Presents an interactor tool for creating color maps.
Structuring: These tools manipulate Data Explorer data structures.
Collect
Collects Objects into a Group. For example, you can use Collect to collect a
streamline, an isosurface, and a light. You can then pass the collection to the
Image tool.
Transformation: These tools generally modify or add to components of the input Field without changing its underlying positions and connections.
Color
Allows you more control over the coloring of an object than is possible with
AutoColor. You can specify a string representing a color (e.g., "spring green"),
an RGB color, or a color map (from the Colormap Editor, for example) to be
applied to a data Field. You can also use the Color module to make objects
(e.g., isosurfaces) translucent.
Equalize
Applies histogram equalization to a field.