In Maple 7.0, the coordinates of a point in 3-D is understood if it is written in the Cartesian form with the syntax [x, y ,z]. Maple can also do 3-D plot with cylindrical coordinates. However this only works for well defined continuous function in 3-D or scattered points in 2-D. So scattered points in 3-D cannot be plotted if the data is in cylindrical coordinates.
Since our original dataset is in cylindrical coordinates, each of the components was transformed into Cartesian coordinates using Excel. Moreover, the magnitude of the angular velocity was scaled 1000 times. This was done or else the value of the angular velocity w will be too small to be seen on the graph. Although the x and y range could easily be adjusted in Maple, this was done to stay consistent with the dataset used for OpenDX where the x and y range could not be easily changed.
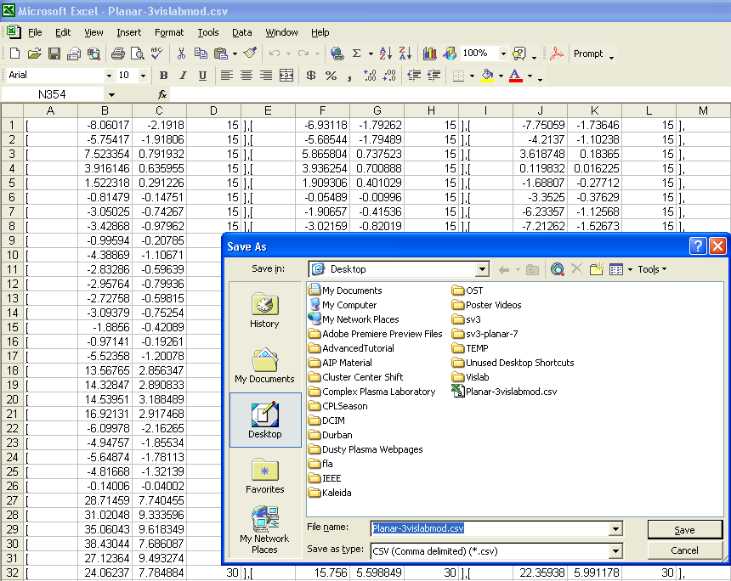
Also columns of [ , ],[ and ], were inserted into the dataset so that we get the syntax necessary for Maple (see figure 7.1.1). The data was then saved in comma delimited (.csv) format. The file was then opened in Microsoft Notepad where the menu Edit>Replace was used to clean up the syntax (see figure 7.1.2). After clean up, the dataset was pasted into Maple.
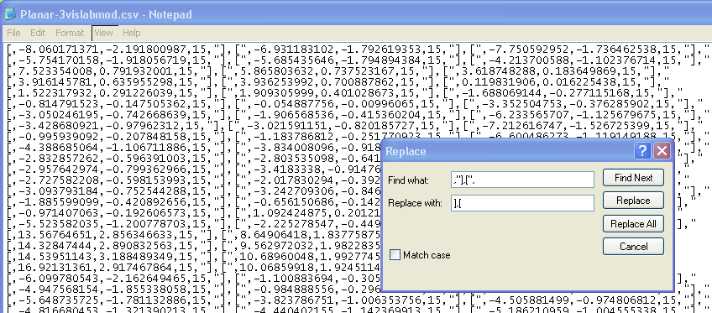
Figure 7.1.2 - The comma delimited format must be cleaned up before it could be fully understood by Maple 7.0.