Grand Slam Statistics
Rod Cross June 2009
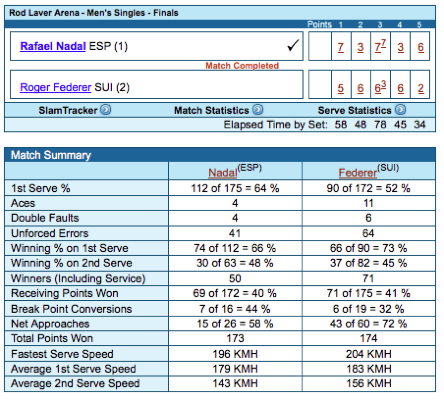
Each match
played at each Grand Slam tournament has a Match Statistics summary on the web
site, similar to the one shown here for the 2009 Australian Open men’s singles
final. The numbers contain valuable information for both players and coaches.
The numbers are also useful for statistics calculations.
As shown by the
Nadal vs Federer example, the winner is not necessarily the one who won the
most points or the most games. The winner is the one who won the important
points and the important games and ended up with the most sets. In the long
run, it makes no difference in a 5-set match if the player loses one of those
sets 6-7 or 2-6, although it might temporarily dent his confidence to lose a
set 0-6. Similarly, it makes no
difference (other than to pride and confidence level) if the player loses a
game to love or loses it after a few deuce points.
Definition
of terms
1st Serve % =
fraction of first serves that went in
(the other first serves being a fault). Nadal served 175 first serves.
112 of those or 64% were good and the other 63 were faults.
Winning % on
1st Serve = fraction of good first serves won by the server. Nadal won 66% of
his good 1st serves, or 74 out of 112.
Winning % on
2nd Serve = fraction of second serves won by the server (some of those serves being lost due to
a double fault). Nadal won 48% or 30 of his 63 2nd serves.
Nadal won 74 +
30 = 104 points while he was serving, out of a possible 175, so he lost 71
points while he was serving. That’s why Federer won 71 out of 175 points when
he was receiving.
Similarly,
Nadal won 69 out of 172 points while he was receiving, so he won 104 + 69 = 173
points altogether.
Nadal had 16
opportunities to break Federer’s serve, and was successful on 7 occasions. He
obviously tried hard to win those points and was successful 44% of the time.
When he was receiving, he won only 40% of the time on average. On the other hand, Federer won 41% of
the points when he was receiving, but he won only 32% of the time when he had a
break point opportunity. Either he wasn’t trying hard enough, or he tried too
hard and hit the ball out too often or Nadal decided that he wanted the point
more than Federer wanted it. Whatever the case, Federer lost the match because
he was unable to convert enough break points and because Nadal converted too
many. A whole match can depend, in retrospect, on just one critical break
point.
Probability of winning a point
The outcome of
a match, in a statistical sense, depends to a large extent on the probability,
p, that the server wins a point
when he (or she) is serving. The formula for p is
p = fw + (1 - f) s
where f = 1st
Serve %, w = Winning % on 1st Serve
and s = Winning % on 2nd Serve
For Nadal, f =
0.64, w = 0.66 and s = 0.48 so p(Nadal) = 0.64 x 0.66 + 0.36 x 0.48 = 0.595.
For Federer, f = 0.52, w = 0.73 and s = 0.45 so p(Federer) = 0.52 x 0.73 + 0.48
x 0.45 = 0.596. Both players had an essentially equal chance of winning a point
when they were serving, so that had an equal chance of winning (or losing) a
game when they were serving. Federer had a bad serving day. He won 73% of his
first serves when they went in, but he got only 52% of them in.
For any given
match, the point probability, p, of the server winning a point can also be
calculated from the total number of service points won by each player. For
example, suppose that player A wins W1 of
his N1 good first serves during the whole match and also wins W2 of his
N2 second serves. Then
p(A) = (W1 + W2)/(N1 + N2)
f = N1/(N1 + N2), w = W1/N1 and s = W2/N2.
Probability of winning a game
How many times
did Nadal step up to serve, and how many times did he win the game when he was
serving? We can work this out from the Table. The total number of games in the
match, from the set score, was 50, not counting the tie-break game. So they
each stepped up to serve 25 times. Federer broke Nadal’s serve 6 times (the 6
conversions) and Nadal broke Federer’s serve 7 times (his 7 conversions). Nadal
won 25 games in total (not counting the tie break game), so he won 18 of his
own service games plus the 7 games he won when he broke Federer’s serve. Federer also won 25 games, so he won 19
of his own service games plus the 6 he won when he broke Nadal’s serve. Nadal’s
chance of winning one of his own service games was therefore 18/25 = 0.72,
while Federer’s chance was 19/25 = 0.76. Nadal won the same number of games as
Federer by winning the tie-break game.
Grand Slam Parameters
Every match is
described by a different set of parameters for each winner and loser. I looked
at each of four Grand Slam tournaments (in 2008 and 2009) and at the last 31
matches in each tournament from Round 3 to the final. The average values for
each tournament, for both men and women singles, are shown in Table 1, where A
= winner and B = loser of each match.
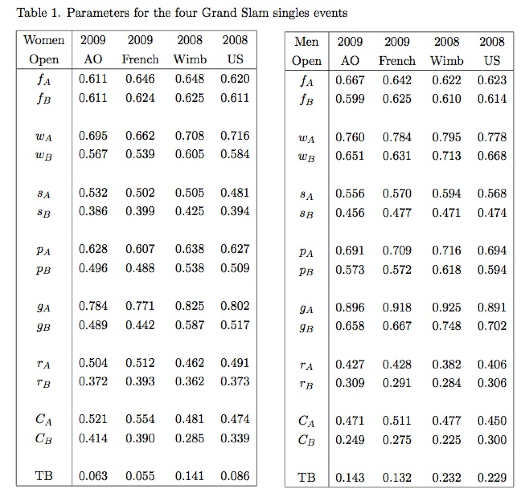
g = probability
of server winning his or her serve game.
r = 1 - p = probability of server losing a point when serving =
probability of the receiver winning the point.
C = Break Point
Conversion % = fraction or percentage of break point opportunities won
(converted) by the receiver.
TB = fraction
of sets that end in a tie break.
Table 1 lists average quantities,
averaged over the N winners and the N losers of each match. For women, N was 31
for the French Open and Wimbledon,
28 at the Australian Open (since three of the matches were not completed)
and 30 at the US Open since the statistics were not correctly recorded in one
match.
Some observations from this table are as
follows:
The 1st Serve
% (f) is about 0.62 at all tournaments for both winners and
losers, for both men and women. Men at the Australian Open averaged 0.67 in
2009.
Winning women
players win about 70% of their good 1st serves at all 4 tournaments (wA ~
0.70), while losing players win only about 58% of their good 1st serves (wB ~
0.58). Men do better, with wA ~ 0.78 and wB ~ 0.66.
Winning women
players win about 50% of their 2nd serves at all 4 tournaments (sA ~ 0.50),
while losing players win only about 40% of their 2nd serves (sB ~ 0.40). Men do
better, with sA ~ 0.57 and sB ~ 0.47.
The probability
of winning a point when serving is about 0.62 for women winners at all 4
tournaments (pA ~ 0.62), and about 0.50 for losers. Men do better, with pA ~
0.70 and pB ~ 0.58.
The probability
of the server winning a game (when serving) is about 0.80 for women winners at
all 4 tournaments (gA ~ 0.80), and about 0.50 for losers, although both figures
are higher at Wimbledon and lower at the French Open, especially for the loser.
The losing woman player can expect to lose serve more than half the time at the
French Open, and about half the time at the Australian and US Open. For men, gA
~ 0.90 and gB ~ 0.68. The serve is more dominant in the men's game.
The winning
woman player can expect to win about half the points when receiving serve (rA ~
0.5), but the losing player wins only about 37% of the points on average when
receiving (rB ~ 0.37). For men, rA ~ 0.40 and rB ~ 0.30, with the result that
there are fewer break point opportunities.
The chance of
converting a break point is about the same as winning any other point when
receiving, when averaged over all players, and is especially difficult for the
losing player at Wimbledon where CB = 0.285 for women and CB = 0.225 for men.
In any individual match, C can be quite different to r. A break point is a
critical point. Some players handle it better than others and actually win a
greater fraction of their break points than any other point, while some players
wilt under the pressure (or are just unlucky) and are less successful when they
face a break point.
Probability of winning a game.
Since p =
probability of winning a point, p
x p is the probability of winning two points in a row when serving, 1-p =
probability of losing a point, and (1-p) x (1- p) is the probability of losing
two points in a row. For example, if p = 0.6, then the server can expect to win
two points in a row 36% of the time, he can expect to lose two points in a row
16% of the time, and he can expect to win then lose a point or lose then win a
point 2 x 0.6 x 0.4 = 48% of the
time. The chance of winning 4 points in a row is 0.6 x 0.6 x 0.6 x 0.6 = 0.13,
so the server can expect to win a game to love 13 % of the time, and can expect
to lose a game to love 2.6% of the time.
Extending this
process to consider all possible outcomes, we can work out the probability,
g, of winning a game, and the
answer (including deuce games) is
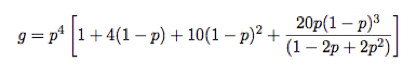
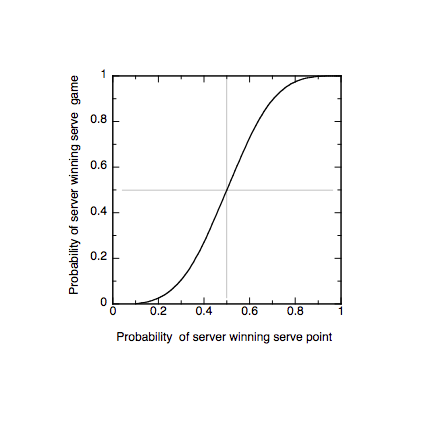
A graph of g vs
p follows, showing that if p = 0.5 then g = 0.5 and that the probability of the
server winning the game increases rapidly with only a small increase in p. For
example, if p = 0.7 then g = 0.90. The probability of the server winning a
point depends on how well he or she is serving and on the ability of the
opponent.
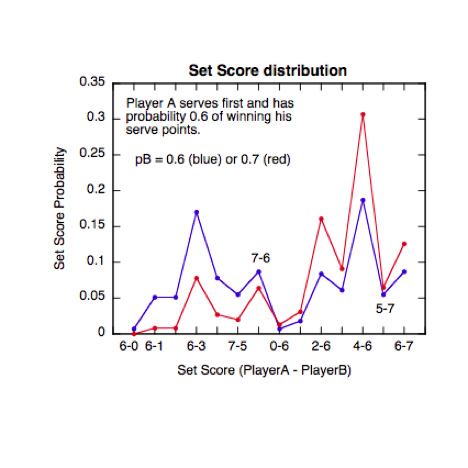
Knowing the
probability that player A wins his service game, and the probability that
player B wins his service game, we can calculate the most likely outcome of the
set and the probability that player A wins 6-0 or 6-1 etc or loses by these
various set scores. Some results are shown below. There are some surprises. For
example if pA = 0.6 and pB = 0.6 then both players are evenly matched. The
various possible outcomes are shown by the blue points, assuming that player A
serves first. It is then more likely that player A will win 6-1 than lose 1-6,
and it is more likely that he will lose 4-6 than win 6-4. The reason is that a
6-4 result can be obtained if player A loses none of his serves or loses up to
4 of his serves, while a 4-6 result can be obtained if player A loses up to 5
of his serves (while B wins 1 serve and loses 4). That is, there are more ways
to lose than to win.
If pA = 0.6 and
pB = 0.7 then the most likely result is that A loses 4-6, but there is also a
small chance that A will win the set. At least, that is the case if every point
is won or lost with the same probability. If player A absolutely refuses to
concede a break point, or if player B is unable to break serve, then player A
will win the set. Table 1 shows that the probability of winning a break point
is not necessarily the same as winning other points. In some matches, C can be
double or half the value of r, meaning that the player wins or loses twice as
many break points as would normally be expected.