![[Image: J, H and K images ]](Fig1col.jpg)
Figure 2
Mosaic images of Cen A in J, H and Kn bands. The arrow marks a foreground star. Each image is 38 x 38 arcsec.
![[Image: Extinction image]](fig3col.jpg)
Figure 5
The J-K extinction image for the central 30 x 30 arcsec showing the dust lane at p.a. of 115 degrees and another region of high extinction at p.a. of 140 degrees, perpendicular to the radio jet axis. The K-band nucleus is marked by the cross.
![[Image: Extinction and velocity images]](Fig5acol.jpg)
Figure 6
(a)Central 16 x 16 arcsec of the J-K extinction image in grey scale and contours. The nucleus is marked by a white cross, and X and Y are marked as discussed in the MNRAS paper as positions on a torus. The SE end of the proposed torus is concealed by the foreground dust lane which lies across the bottom of the image. Contour levels are 1.4, 1.45, 1.5, 1.55, 1.6, 1.65, 1.7, 1.75, 1.8, 1.85, 1.9, 2.0, 2.1, 2.2, 2.3, 2.4 mag/sq. arcsec.
(b) Rydbeck et al. (1993) highest velocity 12CO J=2-1 contours overlaid on the extinction image. Contour levels span the range 24-40 Kkm/s (steps 2.0 Kkm/s). Both images are the same scale. The dotted line is at p.a.=140 degrees.
![[Image: Torus model]](Fig5bcol.jpg)
Figure 7
(a) A cartoon representation of our model for the Cen A torus and ionisation cone.
(b) The transparent model showing the hot dust region (20pc) as a sphere in the centre.
(c) The model with the extinction image overlaid in contours. Contour levels are 1.4, 1.45, 1.5, 1.55, 1.6, 1.65, 1.7, 1.75, 1.8, 1.85, 1.9, 2.0, 2.1, 2.2, 2.3, 2.4 mag/sq. arcsec. A white cross marks the nucleus.
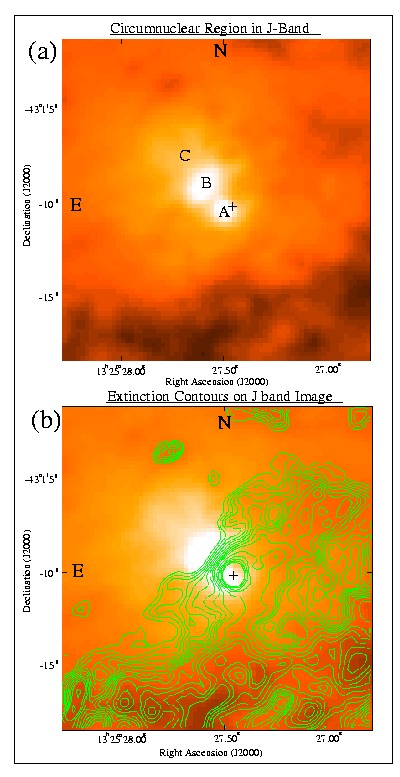
Figure 9
(a) Circumnuclear region in J-band, where A marks the J-band `nucleus' and B and C are along the ionisation cone.
(b) The extinction image of the torus in contours overlaid on the J-band image. Contours are 1.5, 1.55, 1.6, 1.65, 1.7, 1.75, 1.8, 1.85, 1.9, 2.0, 2.1, 2.2, 2.3 mag/sq.arcsec. The cross marks the K nucleus.
![[Image: Slit position for spectra]](slitcol.jpg)
Figure 11
J-band image overlaid with contours of the extinction image. Contours are 1.6, 1.65, 1.7, 1.75, 1.8, 1.85, 1.9, 2.0, 2.1, 2.2, 2.3 mag/sq.arcsec. The rectangle marks the slit position.