Numerical modelling of magnetic fields in AR 10953


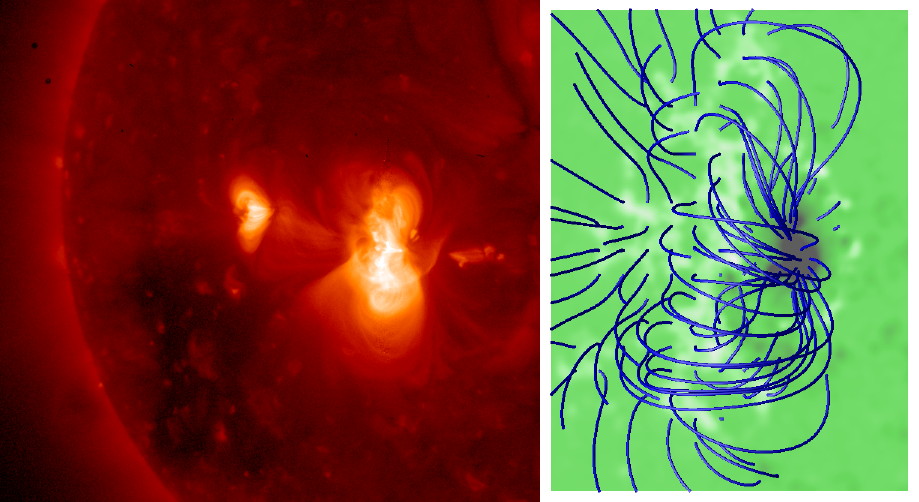
On the left is an image in X-rays of the Sun, taken on 30 April 2007 by the X-ray Telescope (XRT) on the Hinode spacecraft. The limb of the Sun is visible at the left of the image. The bright emitting structure is active region 10953. 
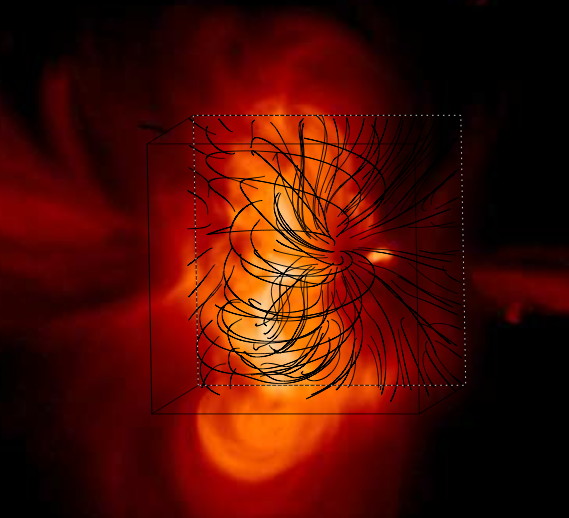
On the right is a numerical model of the magnetic field in this active region produced by Mike Wheatland, which used as input vector magnetic field boundary data from Hinode, obtained at around the same time as the X-ray image at left. The model is shown from a perspective looking down on the computational volume. The blue curves are magnetic field lines, and the vertical field in the lower boundary is indicated by the background image. The computational model is a nonlinear force-free field. The magnetic field B is described by the equations:


which look relatively simple, but are difficult to solve!.

This calculation was performed as part of a series of international workshops on nonlinear force-free modelling, run by personnel from the Lockheed Martin Space and Astrophysics Laboratory. The workshop for 2008 was held at the Max Planck Institute for Solar System Research in Katlenburg-Lindau, near Goettingen in Germany.

At right is an additional image, in which the X-ray image has been overlayed with the magnetic field lines from the calculation, with appropriate scaling and rotation. This image was produced by Marc DeRosa (Lockheed Martin). Clicking on the image opens a larger version. There is a reasonable correspondence between the observed X-ray emitting structures and the model, although it is by no means perfect.

A paper describing this and associated calculations has been accepted for publication (De Rosa et al. 2009). A preprint is available here.


Overlay of observations and model.
Return to Mike Wheatland's home page
Page maintained by m.wheatland@physics.usyd.edu.au Page last updated Tuesday, 24-Feb-2009 15:06:36 EST